The Timeline
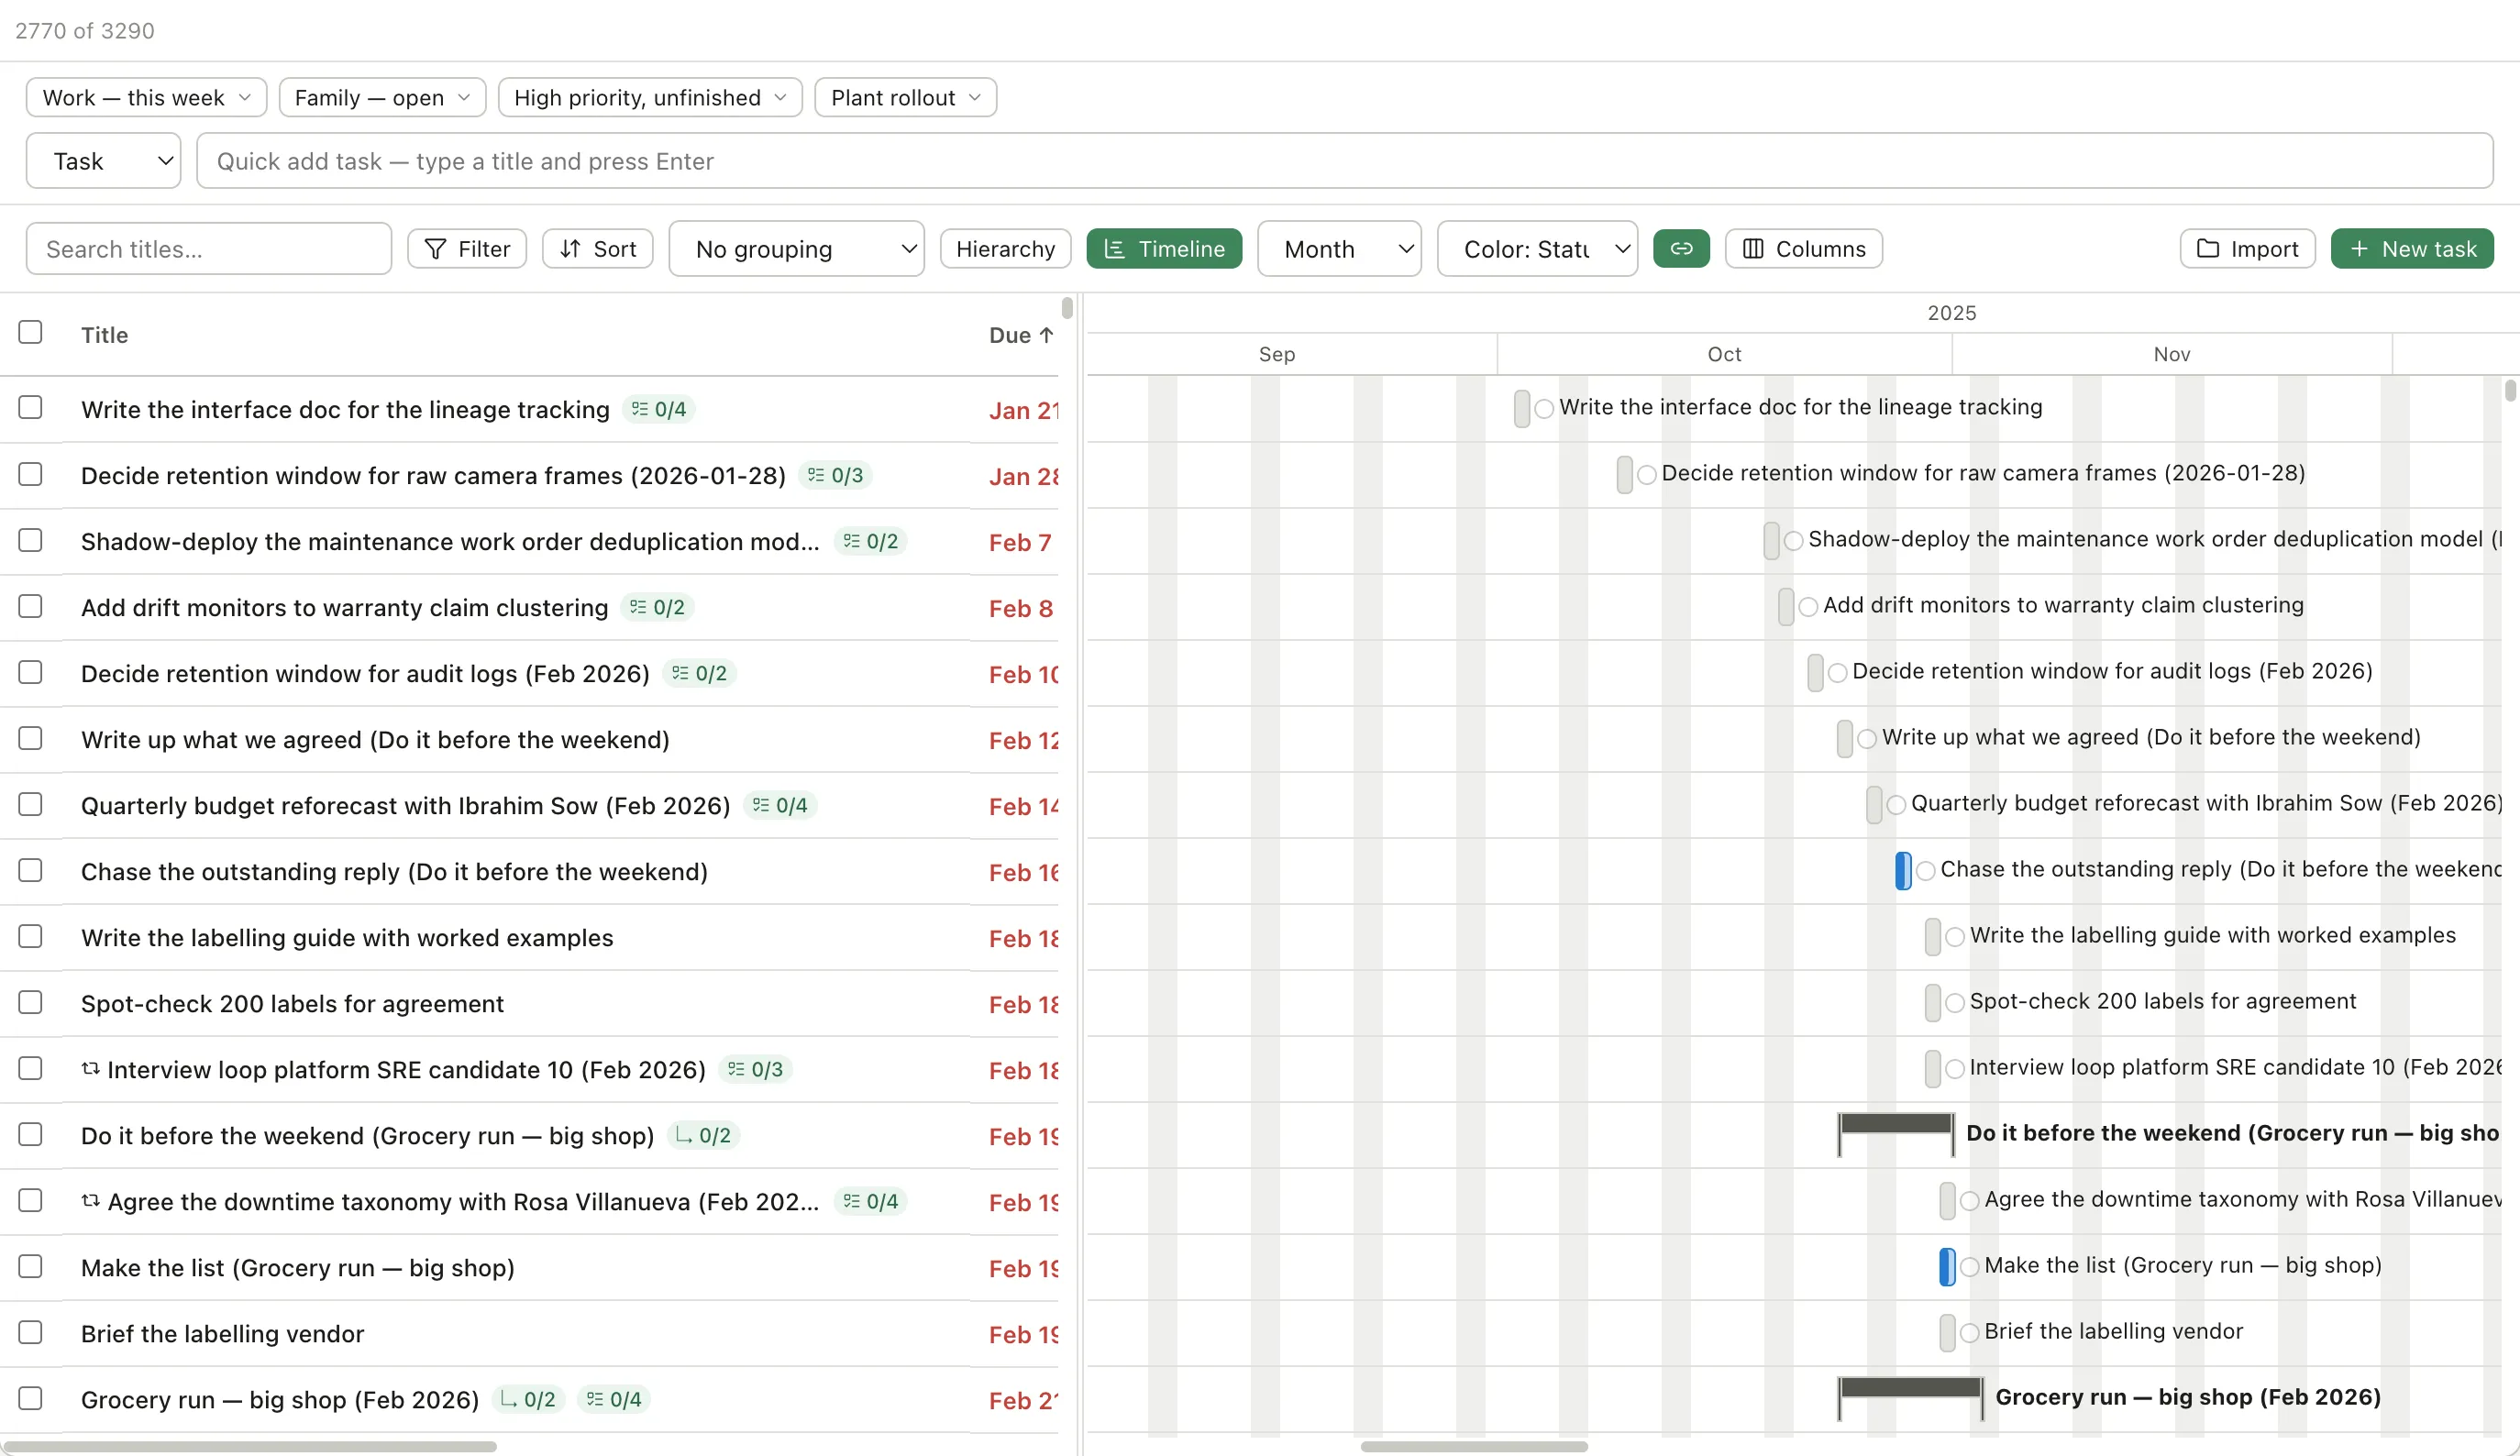
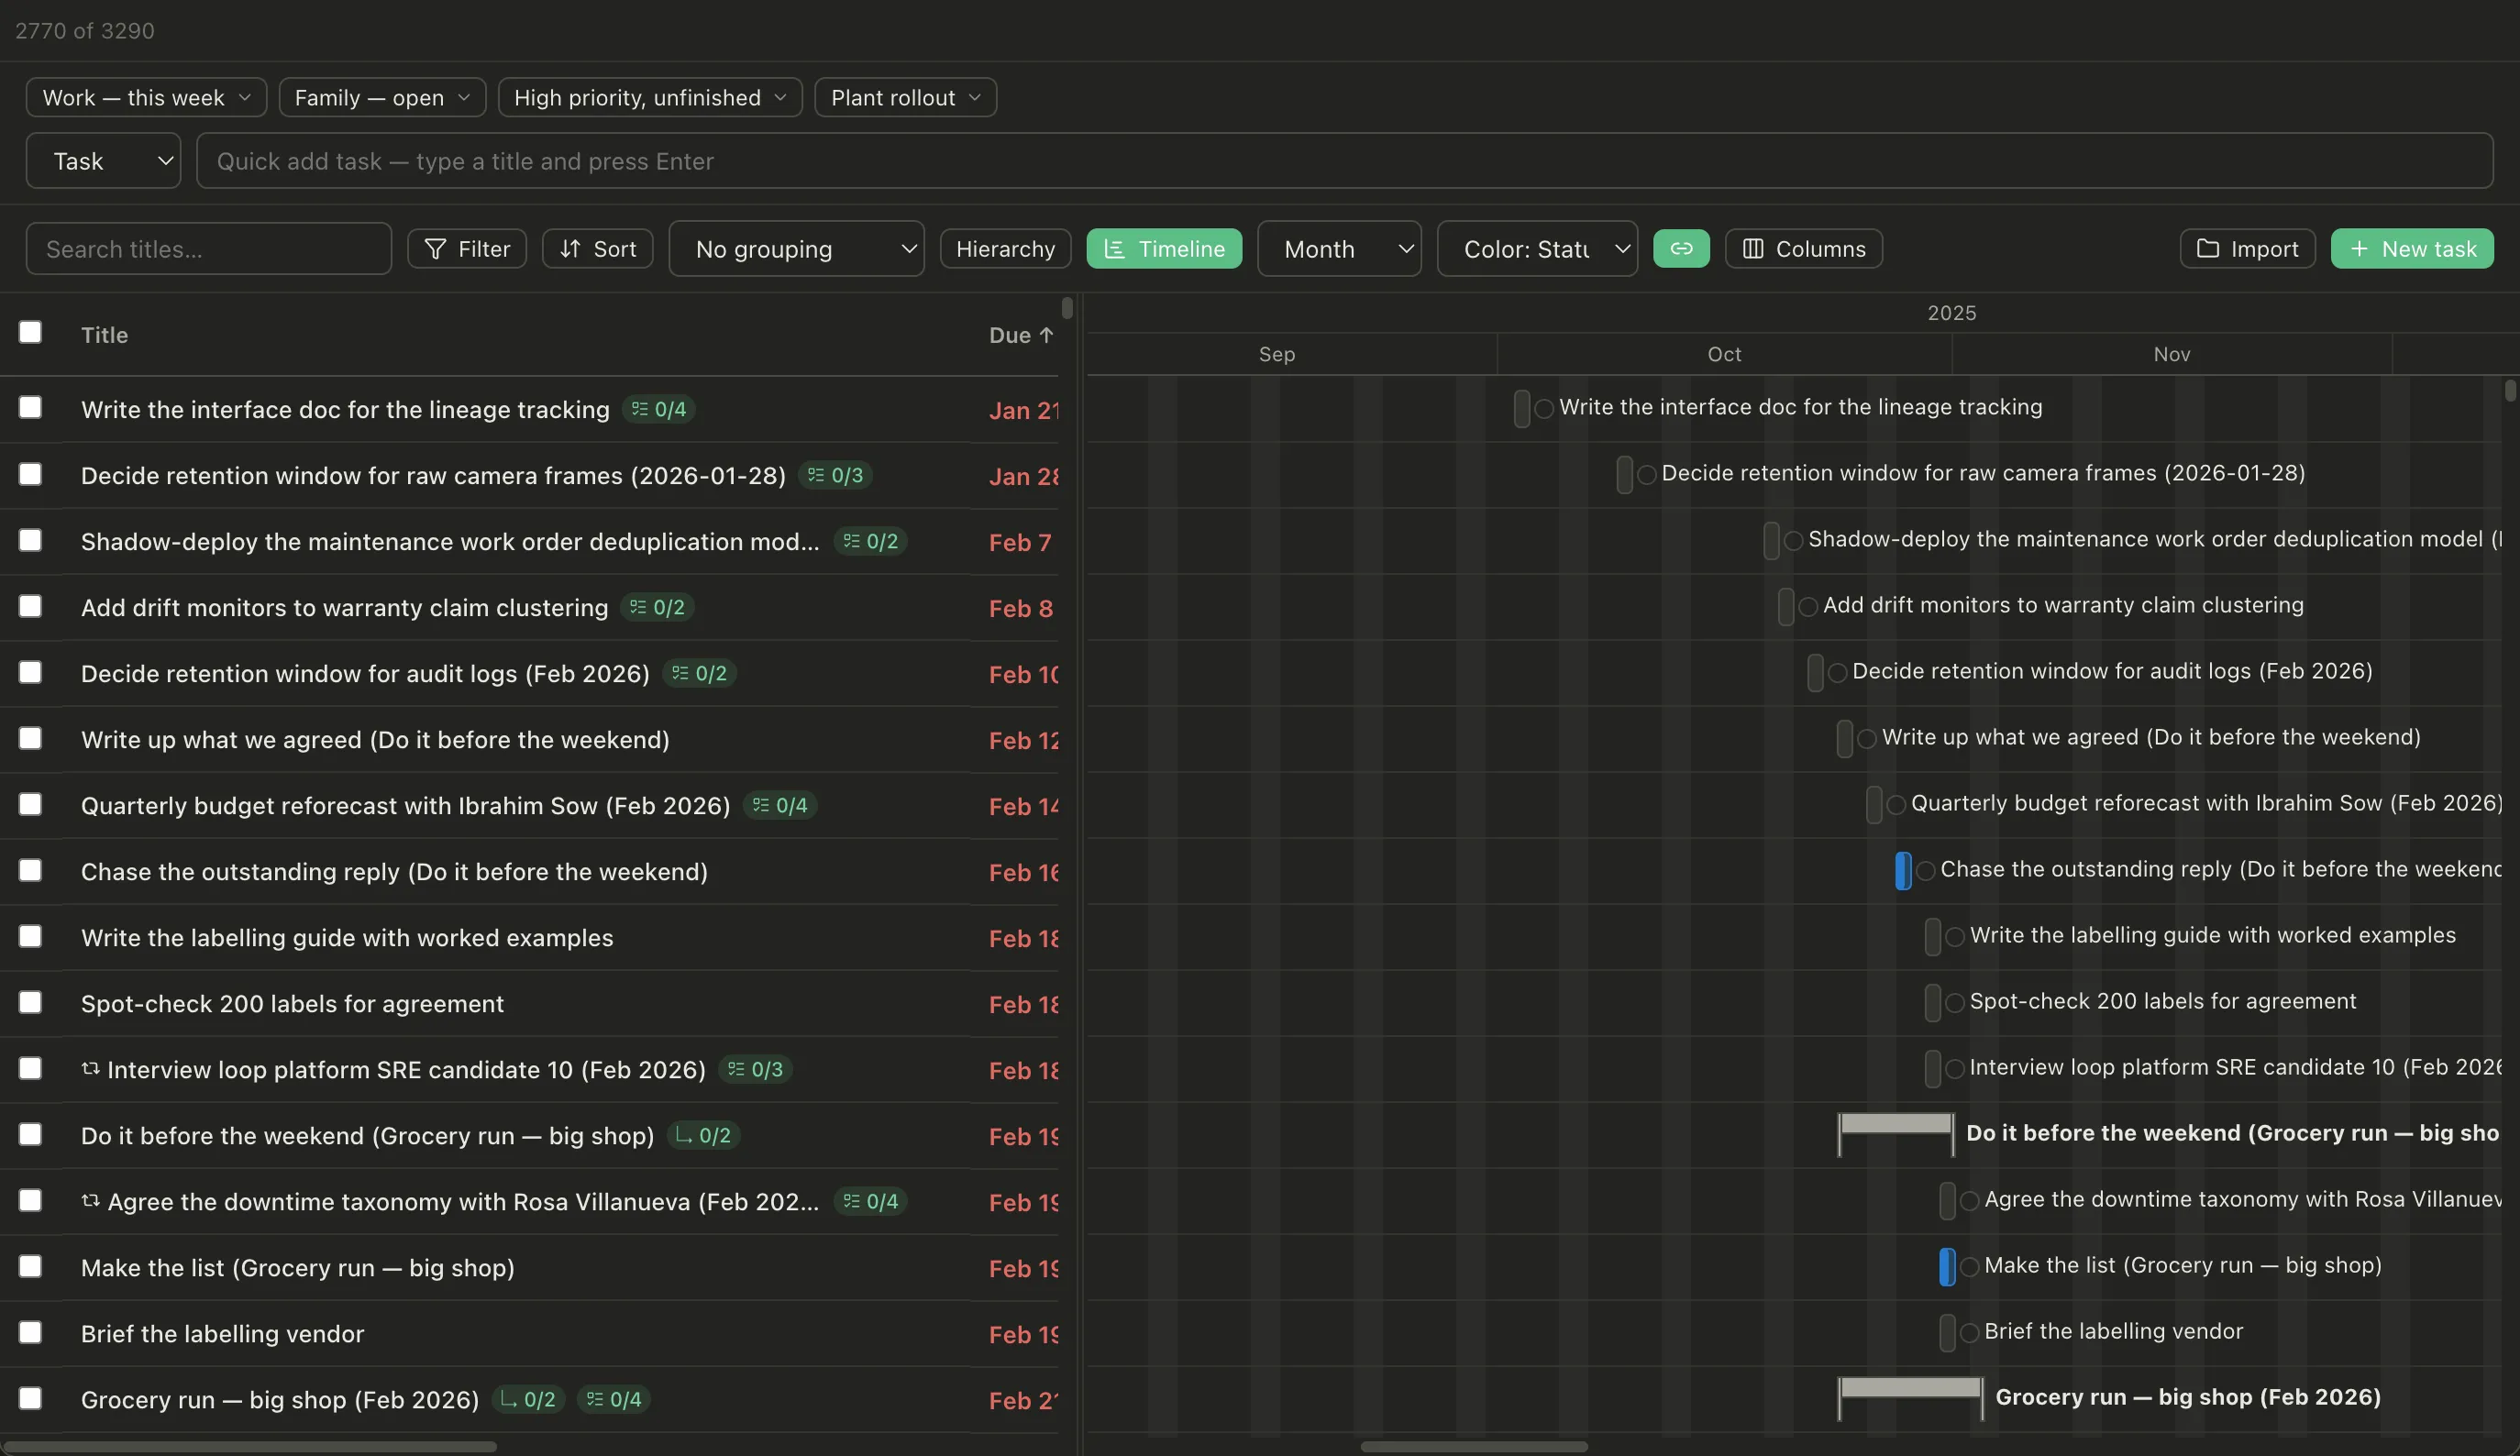
Open it from the Timeline button in the Table toolbar. It slides in beside the table rather than replacing it.
Most people don’t need this. If your work is a list, a list is better. It earns its place when several things have to happen in an order.
What’s on it
Section titled “What’s on it”- Bars for tasks that have a start and an end, shaded to show percent complete
- Parent bars that roll up their children, so a project shows its own span
- Milestones as diamonds, for dates with no duration — a launch, a deadline
- A today line, so “are we behind” is a glance
- Weekend shading, so a five-day estimate doesn’t quietly become five calendar days
Dragging
Section titled “Dragging”- Drag a bar to move the whole task.
- Drag its edge to change how long it takes.
- Drag from one bar to another to say this can’t start until that finishes.
That last one draws a dependency arrow. Click an arrow to remove it.
When you draw something impossible
Section titled “When you draw something impossible”If a dependency says B waits for A, but B is scheduled to start before A ends, the Timeline says so rather than silently drawing a picture that can’t happen. It’s the main reason to use a Gantt chart at all.
Day, week, month or quarter. It scrolls sideways as far as you like.
Click a day or month in the timescale to jump the Calendar to that date.
Color bars by status, priority or group, depending on what you’re trying to see.